In this blog post we will dive deep into the indicators and highlight key findings, as well as provide an analysis of the landscape underlying the indicators and a discussion of potential policy solutions.
Key Findings

Incarceration
At the state level, the Black, American Indian and Alaskan Native, and Latinx incarceration rates are higher than the state average. Black Californians are by far the most likely to be impacted, they are 4 times more likely to be incarcerated than non-Latinx Whites. Statewide, we see that Bay Area counties have most of the lowest incarceration rates in the state, but also some of the highest racial disparities in incarceration. The Yolo, Sutter, and Los Angeles criminal justice systems, result in the most racially disparate incarceration rates. It is important to note that the geographic findings are influenced by where jails or prisons are located and not necessarily indicative of where a person who is incarcerated is from – it is not uncommon, particularly for those incarcerated in prison (vs. jail), for someone to be arrested in one county and incarcerated in another. This is a data limitation that hinders our ability to identify disparities by neighborhood.

Arrests for Status Offenses
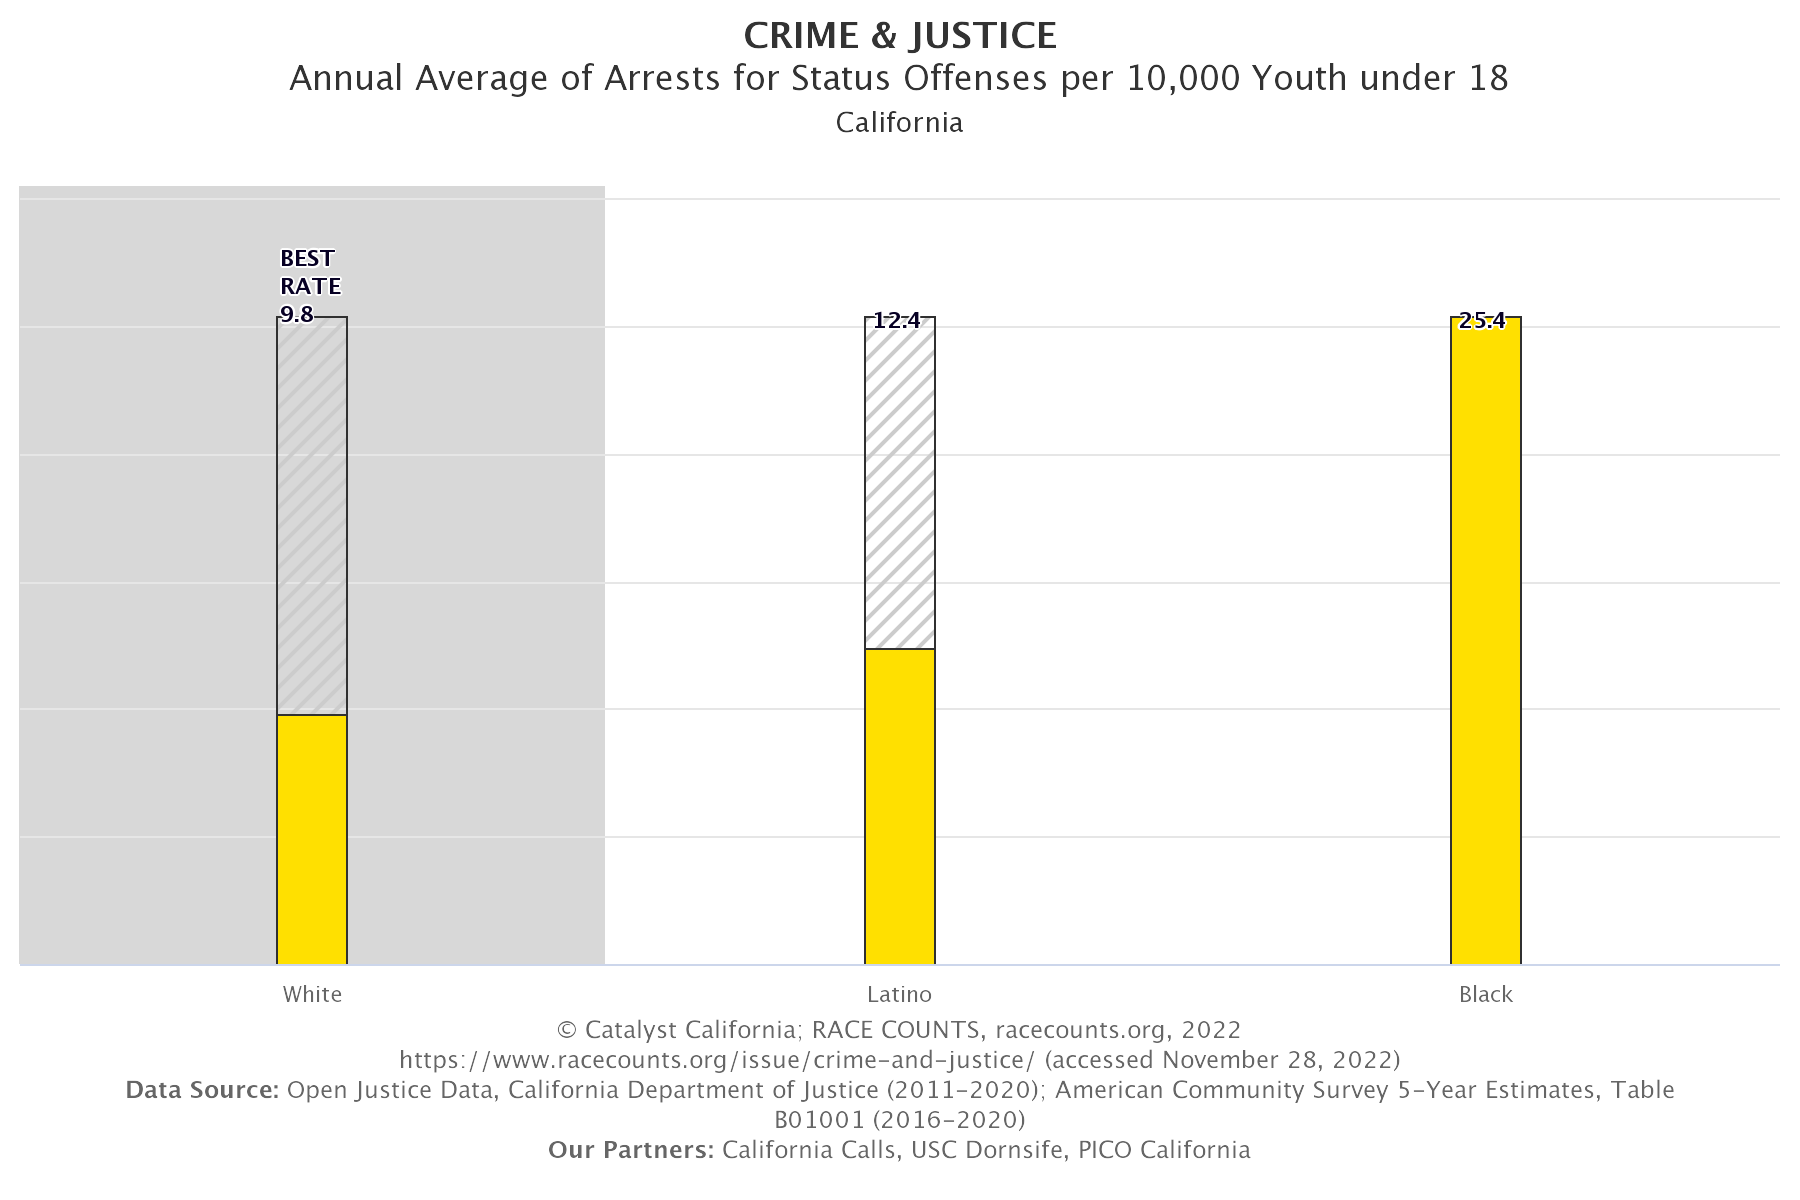
Black and Latinx youth have a higher arrest rate for status offenses, such as truancy and curfew violations for people under age 18, compared to the state average. In fact, Black youth are 2.6 times more likely to be arrested for status offenses than non-Latinx White youth. Glenn, Shasta, and Merced. Humboldt, San Joaquin, San Mateo, and Marin County law enforcement agencies arrest youth at the most racially disparate rates statewide.

Law Enforcement Use of Force
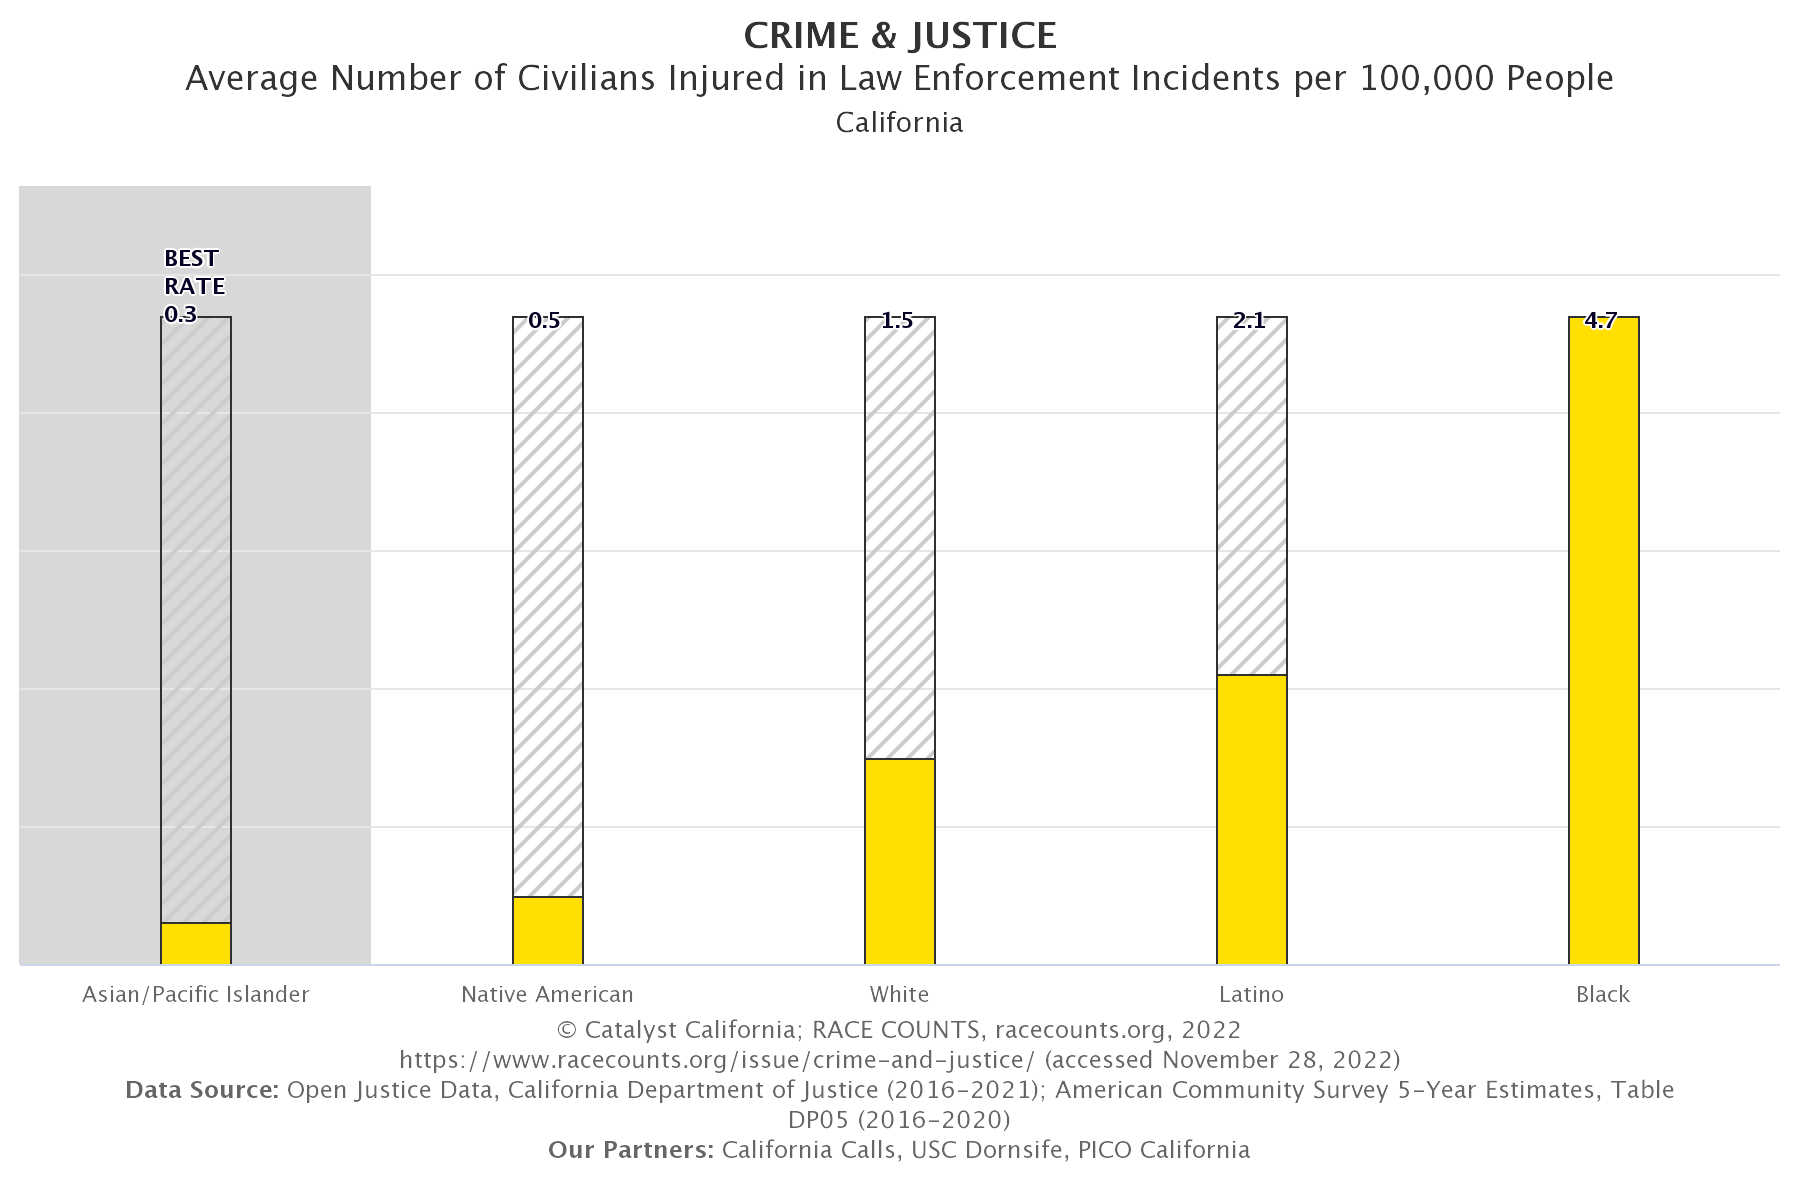
Similar to arrests for status offenses, we see that Black and Latinx Californians are subject to law enforcement uses of force at a greater rate than the state average rate. Black Californians are 2.6 times more likely to be subject to Law Enforcement Use of Force than Californians overall. When examining use of force data by county, we see that law enforcement personnel in rural counties like Tehama, Siskiyou, Glenn and Plumas use force against civilians at the highest rates. Law enforcement personnel in rural counties like Glenn, Del Norte, Plumas, and Siskiyou use force against civilians at the most racially disparate rates statewide.

Perceptions of Safety
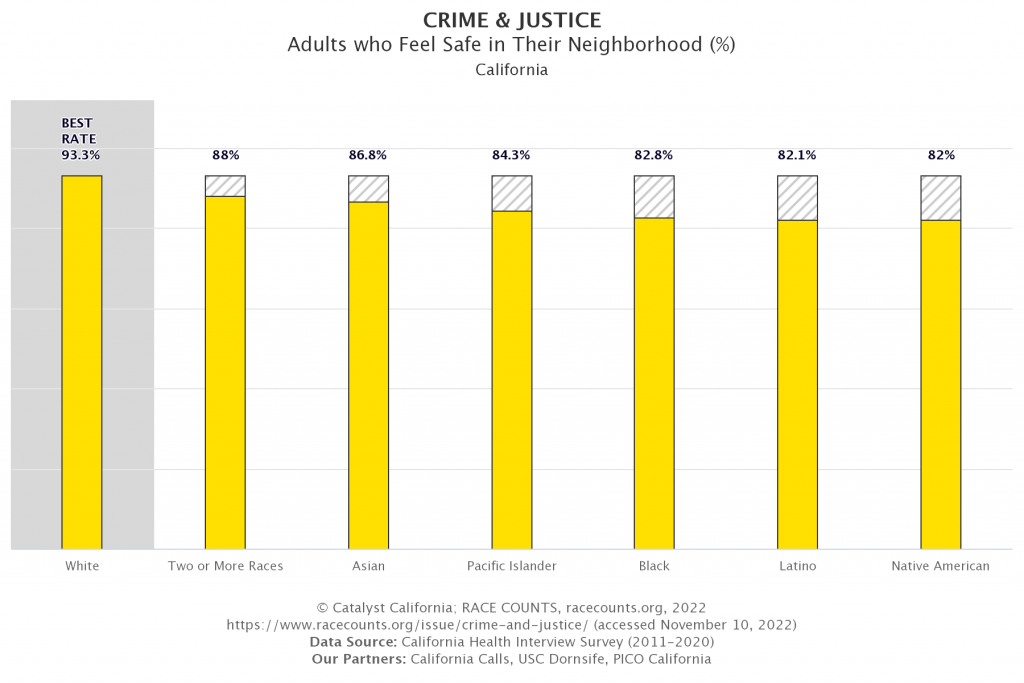
Asian, Pacific Islander, Black, Latinx, and American Indian and Alaskan Native Californians reported feeling safe in their neighborhood at lower rates compared to the state average. Kern, Los Angeles, and Kings County residents are least likely to perceive their neighborhoods as safe. Residents of different races in Marin and Placer Counties are most likely to perceive their neighborhood safety differently. Native Hawaiians and other Pacific Islanders in these counties are far more likely to perceive their neighborhoods as unsafe than residents of other racial-ethnic groups.
Root Causes
From slave patrols to the “war on drugs”
The racial inequities resulting from the criminal legal system can be traced back to a long history of structural racism. As an example, law enforcement in the U.S.A. largely grew out of the Reconstruction Era South “slave patrols” that were formed to apprehend and return enslaved Black people who had escaped.1 More contemporary policies coming out of the “tough on crime” era and “war on drugs” in the 1970s and 1980s – such as harsher punishments for crack (vs. powder) cocaine, mandatory minimums, and “three strike” laws – have also played a significant role in mass incarceration. While these policies are “race neutral,” they have had a disparate impact on communities of color.2
Racially-biased Decision Making
Racially-biased decision making by actors within the criminal legal system plays a large role in racial inequities. Researchers have found bias in law enforcement traffic and pedestrian stop decisions, with the proportion of stops based on reasonable suspicion being higher for Blacks compared to any other racial or ethnic group.3 This is despite research that indicates that Blacks are not more, and often less, likely to be found in possession of contraband or evidence of a crime than White people.4 For a deeper dive on disparities in traffic stops check out the recent Catalyst California and ACLU California Reimagining Community Safety in California report. Research also suggests that racial bias plays a role in uses of force. This research finds that after statistically controlling for contextual factors such as gender, age, stop reason, gun possession, and applicable law enforcement agency, does not eliminate racial disparities in incidents where an officer pointed a gun at or shot a person.5 Law enforcement officers are not the only criminal legal system actors to make biased decisions. Prosecutors, judges, and probation and parole officers often make biased decisions – such as which offense to charge, length of sentence, and probation or parole denials or revocations – that result in racial inequities. As mentioned earlier, many of these decisions are constrained by “race neutral” policies – for example, the policy that mandated more severe punishment for crack (vs. powder) cocaine – that have disparate impacts on people of color.
One key factor that can result in racially-biased decision making is implicit bias. Research shows that due to implicit bias actors within the criminal legal system may have negative associations with people of color, and Black people in particular, that can influence their decisions and behaviors.6 Implicit bias can also impact perceptions of safety based on neighborhood demographics.7 Furthermore, politicians, the media, and “law and order” proponents will often engage in fear mongering that can increase concerns around public safety to serve their own means – often at the expense of people of color who are often portrayed as threats to public safety.
Inequitable Resource Allocation and Community Disinvestment
In addition to the history of systemic racial discrimination in the criminal legal system, there is also a legacy of systemic discrimination and disinvestment in the areas of housing, education, and economic development that led to racially segregated communities with high concentrations of poverty. However, in many of these communities it is common to see significant allocation of resources towards law enforcement and incarceration and relatively little allocation of resources towards addressing the underlying socioeconomic conditions affecting low-income communities and communities of color. In fact, law enforcement spending now consumes the largest share of many localities’ discretionary revenues—crowding out the possibility of funding other government functions that are better suited to address social problems.8
Potential Policy Solutions
Increase Law Enforcement Accountability
The status quo provides limited oversight of and accountability for law enforcement. Too often when law enforcement officers perpetuate harm or behave unjustly, they face few if any consequences. Increasing accountability is a key mechanism to help reduce racial disparities in criminal legal system outcomes. The need for greater accountability is part of why Catalyst California has endorsed Measure A in Los Angeles County, a ballot measure in the upcoming November election that would increase accountability of the L.A. County Sheriff’s Department by allowing the L.A. County Board of Supervisors Sheriff to be removed for cause with a supermajority vote (as of this writing, it appears that L.A. voters have approved this measure). One additional way to increase accountability is to promote greater transparency, including making data and law enforcement records publicly available.
Decrease Role of Law Enforcement
Law enforcement plays a large role in our system of public safety. This role includes serving as first responders to a variety of social and quality of life issues such as homelessness, behavioral health crises, and substance abuse. These issues would be better addressed through non-law enforcement care-centered approaches. Despite their role in responding to these issues, law enforcement agencies receive little training and are largely unqualified or ill-suited to address these issues. As a result of this role, individuals are often exposed to law enforcement unnecessarily exposing individuals to potentially harmful, racially-biased interactions that could lead to being the victim of a use of force incident, arrest, and ultimately incarceration. To address this, the scope of law enforcement should be reduced. One potential avenue for reducing the role of law enforcement is limiting their authority to enforce traffic safety. Law enforcement dedicates a substantial amount of time and resources towards stopping people for minor traffic violations that pose non-imminent and relatively low safety risks. Furthermore, data indicates that there are often racial inequities in who gets stopped for traffic violations.9 As an alternative to having law enforcement be responsible for minor traffic violations, this responsibility could be shifted to unarmed members of a department of transportation. Furthermore, trained professionals other than law enforcement such as outreach workers, behavioral health professionals, and can be utilized as first responders to events such as mental health crises. Violence interventionists are also potential alternatives to armed law enforcement that can be used help promote public safety.
Decriminalization
One key to reducing the racial inequities in incarceration is decriminalization. As mentioned earlier, many of the racial inequities we see in incarceration are connected to the “tough on crime” policies that increased the punishment and penalties for a variety of crimes. Examples of decriminalization policies include:
- making current offenses that pose little to no safety risk no longer illegal;
- policies that decrease the severity of offenses that are currently categorized too harshly;
- policies that remove or decrease criminal penalties for offenses that are a product of socioeconomic inequities, are overly harsh, or do not advance safety;
- and policies that create a system for reviewing the sentences of people currently incarcerated who are subject to lengthy terms (e.g., over 10 years) to determine whether they should be released.
In addition to decriminalization, progressive prosecutorial reform is a vital path for reducing racial inequities in incarceration. District Attorneys have significant power in the criminal legal system including having influence over whether charges are filed, referral to diversion programs, bail, offenses charged, settlements, and recommended sentencing. Historically, this discretion has had a disparate impact on people of color – for example research finds that “Black people are more likely to be subjected to pre-trial detention, receive a plea offer, and receive harsher punishments than their White counterparts.”10 To offset such outcomes, a concerted effort should focus on promoting common-sense charge filing policies that advance racial equity and improve long-term safety.
Urgency of Action
The racial inequities apparent in the updated RACE COUNTS Crime & Justice data show that Californians of color are disproportionately impacted by the criminal legal system. These inequities are the result of a criminal legal system that has too little accountability, is rife with racial bias, and a “tough on crime” mentality that prioritizes a law and order (vs. a care-centered) approach. By pushing for increasing accountability, reducing the role of law enforcement to focus on serious crimes and true threats to community safety, promoting a care-centered ecosystem and care first responses to quality-of-life issues, and advancing decriminalization will serve to address the racial inequities in the criminal legal system and promote public safety. To learn more about what Catalyst California is doing alongside our community partners to address racial inequities in the criminal legal system and to promote community safety visit the Catalyst California Reimagine Justice & Safety website.
- “The Origins of Modern Day Policing.” NAACP, December 3, 2021. https://naacp.org/find-resources/history-explained/origins-modern-day-policing. ↩︎
- Mauer, Marc. Rep. The Changing Racial Dynamics of the War on Drugs. The Sentencing Project, April 2009. https://www.sentencingproject.org/wp-content/uploads/2016/01/The-Changing-Racial-Dynamics-of-the-War-on-Drugs.pdf. ↩︎
- RIPA Stop Data, State of California Department of Justice, Open Justice, accessed March 11, 2022, https://openjustice.doj.ca.gov/exploration/stop-data. ↩︎
- Pierson, E., Simoiu, C., Overgoor, J. et al. A large-scale analysis of racial disparities in police stops across the United States. Nat Hum Behav 4, 736–745 (2020). https://doi.org/10.1038/s41562-020-0858-1 ↩︎
- Person, Deepak Premkumar, Alexandria Gumbs, Shannon McConville, and Renee Hsia. “Police Use of Force and Misconduct in California.” Public Policy Institute of California. Public Policy Institute of California, February 25, 2022. https://www.ppic.org/publication/police-use-of-force-and-misconduct-in-california/. ↩︎
- Implicit Bias, National Initiative of Building Community Trust and Justice, Accessed on October, 31, 2022. https://trustandjustice.org/resources/intervention/implicit-bias. ↩︎
- Ghandnoosh, Nazgol. “Race and Punishment: Racial Perceptions of Crime and Support for Punitive Policies.” The Sentencing Project, March 28, 2016. https://www.sentencingproject.org/publications/race-and-punishment-racial-perceptions-of-crime-and-support-for-punitive-policies/. ↩︎
- Emily Badger and Quoctrung Bui, Cities Grew Safer. Police Budgets Kept Growing, (NYT June 12, 2020), https://www.nytimes.com/ interactive/2020/06/12/upshot/cities-grew-safer-police-budgets-kept-growing.html. ↩︎
- “Reimagining Traffic Safety & Bold Political Leadership in Los Angeles.” RACE COUNTS, May 4, 2021. http://www.racecounts.org/push-la. ↩︎
- Kutaeladze, Besiki. Cumulative Disadvantage: Examining Racial and Ethnic Disparity in Prosecution and Sentencing, Criminology: An Interdisciplinary Journal, 52(3), 514-551 (2014). https://psycnet.apa.org/record/2014-35716-001. ↩︎